R introduction
Rstudio
RStudio is a free and open-source integrated development environment (IDE) for R, a programming language for statistical computing and graphics.
RStudio was founded by JJ Allaire, creator of the programming language ColdFusion. Hadley Wickham is the Chief Scientist at RStudio.
ggplot2
ggplot2 is a data visualization package for the statistical programming language R. Created by Hadley Wickham in 2005. It’s a function to build plots piece by piece.
The concept behind ggplot2 divides plot into three different fundamental parts: Plot = data + Aesthetics + Geometry.
The principal components of every plot can be defined as follow:
- data is a data frame
- Aesthetics is used to indicate x and y variables. It can also be used to control the color, the size or the shape of points, the height of bars, etc.
- Geometry defines the type of graphics (histogram, box plot, line plot, density plot, dot plot, ..)
There are two major functions in ggplot2 package:
qplot() stands for quick plot, which can be used to produce easily simple plots.
ggplot() function is more flexible and robust than qplot for building a plot piece by piece.
Install and load ggplot2 package:
#install.packages("ggplot2")
library(ggplot2)
plot type selection
One variable: Continuous
- geom_area(): Create an area plot
- geom_density(): Create a smooth density estimate
- geom_dotplot(): Dot plot
- geom_freqpoly(): Frequency polygon
- geom_histogram(): Histogram
- stat_ecdf(): Empirical Cumulative Density Function
- stat_qq(): quantile - quantile plot
One variable: Discrete
Two variables: Continuous X, Continuous Y
- geom_point(): Scatter plot
- geom_smooth(): Add regression line or smoothed conditional mean
- geom_quantile(): Add quantile lines from a quantile regression
- geom_rug(): Add marginal rug to scatter plots
- geom_jitter(): Jitter points to reduce overplotting
- geom_text(): Textual annotations
Two variables: Continuous bivariate distribution
- geom_bin2d(): Add heatmap of 2d bin counts
- geom_hex(): Add hexagon bining
- geom_density_2d(): Add contours from a 2d density estimate
Two variables: Continuous function
Two variables: Discrete X, Continuous Y
- geom_boxplot(): Box and whiskers plot
- geom_violin(): Violin plot
- geom_dotplot(): Dot plot
- geom_jitter(): Strip charts
- geom_line(): Line plot
- geom_bar(): Bar plot
Two variables: Discrete X, Discrete Y
Two variables: Visualizing error
- geom_crossbar(): Hollow bar with middle indicated by horizontal line
- geom_errorbar(): Error bars
- geom_errorbarh(): Horizontal error bars
- geom_linerange() and geom_pointrange(): An interval represented by a vertical line
- Combine geom_dotplot and error bars
Two variables: Maps
Three variables
Interesting R
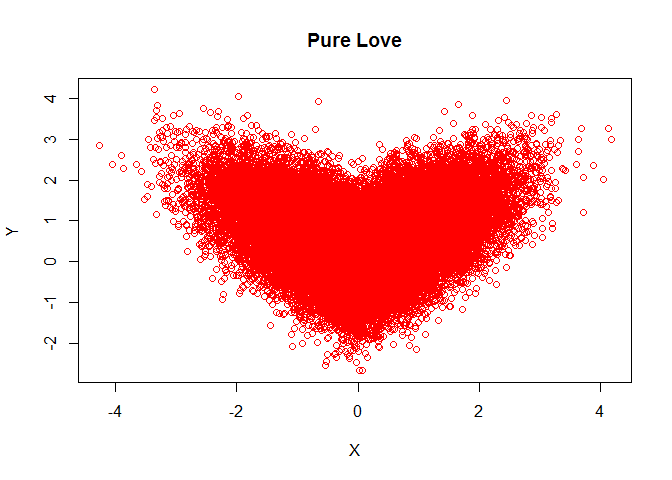
Pure Love
n=50000;
r=0.7;r_e=(1-r*r)^.5;
X=rnorm(n);
Y=X*r+r_e*rnorm(n);
Y=ifelse(X>0,Y,-Y);
plot(X,Y,col="red", main = "Pure Love")
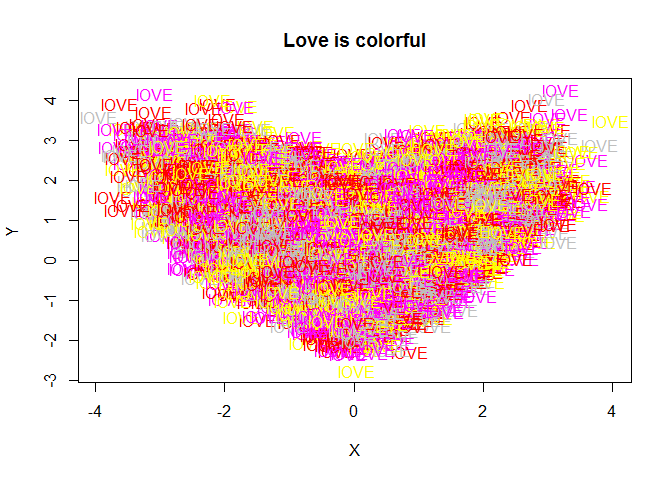
Love is colorful
n=50000;
r=0.7;r_e=(1-r*r)^.5;
X=rnorm(n);
Y=X*r+r_e*rnorm(n);
Y=ifelse(X>0,Y,-Y);
a<-sample(c(2,6,7,8),50000,T)
b<-sample(c(76,79,86,69),50000,T)
plot(X,Y,col=0, main = "Love is colorful")
text(X,Y,"lOVE",col=a)
Embarrassing
library(ggplot2)
f <- function(x) 1/(x^2-1)
x <- seq(-3,3, by=0.001)
y <- f(x)
d <- data.frame(x=x,y=y)

p <- ggplot()
p <- p+geom_rect(fill = "white",color="black",size=3,
                 aes(xmin=-3, xmax=3, ymin=-3,ymax=3, alpha=0.1))

p <- p + geom_line(data=d, aes(x,y), size=3)+ylim(-3,3)
p <- p + theme_bw() +
    theme(axis.text.x=element_blank(),
          axis.text.y=element_blank(),
          legend.position="none",
          panel.grid.minor=element_blank(),
          panel.grid.major=element_blank(),
          panel.background=element_blank(),
          axis.ticks=element_blank(),
          panel.border=element_blank())

p <- p+xlab("")+ylab("")
print(p)

So, R is quite interesting and attracting, why not learn it. Let’s go~
References
Be Awesome in ggplot2
R STHDA
Interesting R
Cookbook for R
ggplot2 for bignners
ggplot2 - Essentials
Guide to Create Beautiful Graphics in R (Book)