Hazard Ratio
Definition of Hazard Ratio
Hazard ratio (HR) is a measure of an effect of an intervention on an outcome of interest over time. Hazard ratio is reported most commonly in time-to-event analysis or survival analysis (i.e. when we are interested in knowing how long it takes for a particular event/outcome to occur). The outcome could be an negative outcome (e.g. time from treatment/surgery until death/relapse) or a positive outcome (e.g. time to cure/discharge/conceive/heal or disease-free survival).
HR = Hazard in intervention group / Hazard in control group
Hazard represents the instantaneous event rate, which means the probability that an individual would experience an event (e.g. death/relapse) at a particular given point in time after the intervention, assuming that this individual has survived to that particular point of time without experiencing any event.
Confidence Interval (CI): is the range of values that is likely to include the true population value and is used to measure the precision of the study’s estimate (in this case, the precision of the Hazard Ratio). The narrower the confidence interval, the more precise the estimate. (Precision will be affected by the study’s sample size). If the confidence interval includes 1, then the hazard ratio is not significant.
Interpretation of Hazard Ratio
Because Hazard Ratio is a ratio, then when:
HR = 0.5: at any particular time, half as many patients in the treatment group are experiencing an event compared to the control group.
HR = 1: at any particular time, event rates are the same in both groups
HR = 2: at any particular time, twice as many patients in the treatment group are experiencing an event compared to the control group.
Kaplan-Meier curve
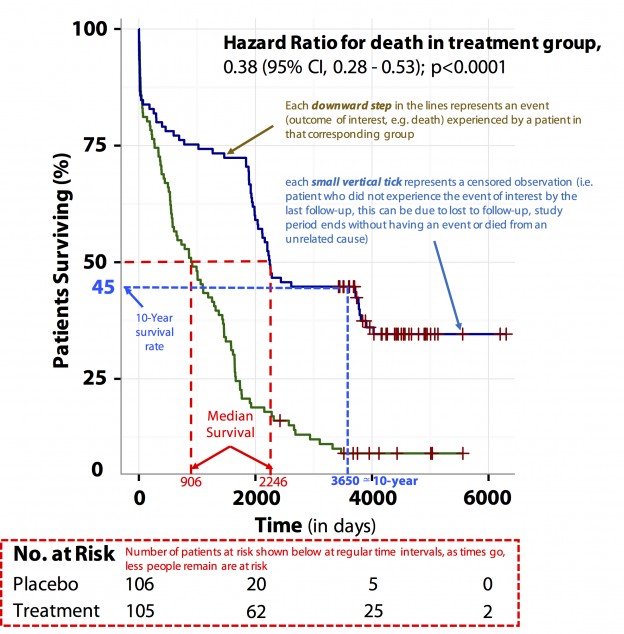
(Blue line represents treatment group and green line represents control group).
Kaplan-Meier curve: is a graphical method of displaying survival data or time-to-event analysis (i.e. the proportion of patents surviving against time) and is usually drawn as a step function.
-
The horizontal axis represents the time of follow-up starting from enrolment while the vertical axis represents the estimated probability of survival.
-
Each downward step in the lines represents an event (the outcome of interest, e.g. death) experienced by a patient in that corresponding group, while each small vertical tick represents a censored observation (i.e. a patient who did not experience the event of interest by the last follow-up. This can be due to being lost to follow-up, the study period ending without an event or because the patient died from an unrelated cause).
-
The numbers of patients at risk at regular time intervals is shown at the bottom of the figure. With time, fewer people remaining are at risk.
-
This graph also allows you to detect the progression of the condition (e.g. early postoperative mortality or a serious adverse event caused by the drug), by the presence of a notable sudden steep drop in survival at a particular time point.
Interpretation of this figure
The results of this graph can be communicated in various ways:
- Median survival: half of the patients in the treatment group have survived for 2246 days (median survival rate) compared to 906 days in the control group.
- Difference in median survival: On average, patients in the intervention group survived for 1340 days longer than patients in the control group (2246 – 906 days).
- Proportion surviving at a specific time point: about 45% of patients in the treatment group have survived for 10 years (3650 days, i.e. 10-year survival rate). Another way of saying this is that about 45% of the patients in the treatment group have not experienced the outcome of interest (e.g. death) after 10 years of follow-up.
Hazard Ratios vs. Risk Ratios (or Relative Risk)
Hazard ratio is frequently interpreted as risk ratio (or relative risk), but they are not technically the same. However, if that helps you to understand hazard ratio then it is OK. But keep in mind HR is not RR.
One of the main differences between risk ratio and hazard ratio is that risk ratio does not care about the timing of the event but only about the occurrence of the event by the end of the study (i.e. whether they occurred or not: the total number of events by the end of the study period). In contrast, hazard ratio takes account not only of the total number of events, but also of the timing of each event.