Seven deadly sins of statistics and how to avoid them
今天统计部门的领导在PiCR课上给我们讲了如何规避统计分析中的7个陷阱。废话不多说,直接上干货。
Sin 1: Using uninformative or misleading plots**
How to avoid:
-
Be critical what plots you use: can the reader extract all necessary information?
-
Don’t use bars representing the mean with whiskers representing? SD? SEM?
-
Use Dotplots for small data sets.
-
Use Boxplots if you have enough data points.

Sin 2: Ignoring the hierarchical structure of data**
How to avoid:
-
Be aware of multiple levels on experiments (like concentration gradients).
-
Technical replicates are generated to account for technical variability.
-
Technical variability is typically not the focus of interest.
-
Biological replicates are necessary to obtain information about biological variability.
-
Choose appropriate statistical analysis method for the evaluation of multi-level data:
-
Mixed effects models (statistically challenging)
-
Substitute in case of technical replicates of biological replicates:
- average technical replicates for every biological replicate.
-
Sin 3: State that you proved the null hypothesis
How to avoid:
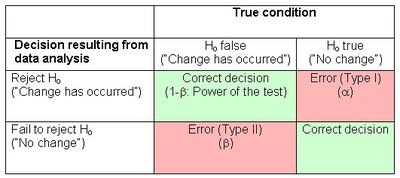
Type I error: False positive
Type II error: False negative
-
Type I error probability is selected by investigator.
-
Type II error probability is unknown. It depends on unknown truth (What’s the real difference? How much variability?)
-
Keep statistical errors (type I, type II) in mind:
- if H0 can be rejected: has type I error occurred?
- if H0 can not be rejected: has type II error occurred?
-
Do you want to “prove the null hypothesis”?
Example: Does a generic drug have the same effect as a brand-name drug?
–> switch the roles of null and alternative hypothesis –> “equivalence” testing
Sin 4: Not distinguishing between statistical significance and practical relevance**
How to avoid:
-
Not only perform statistical testing (and get a p-value) but always derive confidence intervals to get an estimate of effect size.
-
The 95%-confidence interval covers the true effect with probability 95%.

Something you should know:
- 95% CI indicates that we are 95% confident that the population mean will fall within the range described. So CI is similar to a measure of spread, like SD.
- As sample size increase or variability in the measurement decrease, the CI will become more narrow. And the results will be more precise.
- CI can be used similar to a p-value to determine significant differences, but conveys more useful information than p values
- Always report 95% CI with p-value, not report solely p-value. If only one is to be reported, then it should be CI, because p value is less important and can be deduced from CI
- never interpret p-value > 0.05 as an indication of no difference or no association, only the CI can provide this message. (absence of evidence does not equate to evidence of absence)
Sin 5: Select variables for multivariable model by significance in univariable models
How to avoid:
-
Include variables in the model with regards to scientific content.
比如,研究肺癌的影响因素的时候,吸烟即使统计上不显著也得放入模型呀,小朋友们
-
Use statistical variable selection procedures (老师说,这些个方法一般适用于变量数小于30的):
- stepwise selection
- backward selection
- forward selection
- best subset selection
-
In case of high-dimensional covariables (e.g., omics data)
- complex variables selection methods available. (In my opinion, PCA/PLS-DA/lasso regression and other methods)
Sin 6: Report accuracy of newly developed method on training data
How to avoid:
-
Be aware of overfitting.
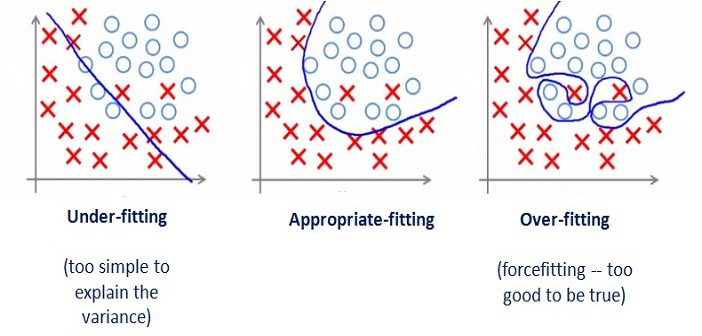
-
Don’t report accuracy on training set. It will most probably be good and it will be overoptimistic.
-
Challenge the new method (score, cut-off value for a score, prediction model …) by applying it to a separate test set.
-
If no separate test set is available, split your data set into training and test set.
-
Crossvalidation, bootstrapping, …
Sin 7: Connect statisticians at the last step
How to avoid:
从实验的设计开始就要有统计学家的参与,因为他们可以预见一些数据处理时候的问题。比如你要是没重复没对照,估计统计学家不会理你,毕竟巧妇难为无米之炊。