Youden Index/Cut-Off
Definition
Youden’s J statistic (also called Youden’s index) is a single statistic that captures the performance of a dichotomous diagnostic test. Informedness is its generalization to the multiclass case and estimates the probability of an informed decision.
J = sensitivity + specificity − 1
The index value ranges from -1 to 1:
J = 0: a diagnostic test gives the same proportion of positive results for groups with and without the disease, i.e the test is useless.
J = 1: there are no false positives or false negatives, i.e. the test is perfect.
Find cut-offs with OptimalCutpoints
library(pROC)
library(OptimalCutpoints)
data(aSAH)
head(aSAH)
##    gos6 outcome gender age wfns s100b  ndka
## 29    5    Good Female  42    1  0.13  3.01
## 30    5    Good Female  37    1  0.14  8.54
## 31    5    Good Female  42    1  0.10  8.09
## 32    5    Good Female  27    1  0.04 10.42
## 33    1    Poor Female  42    3  0.13 17.40
## 34    1    Poor   Male  48    2  0.10 12.75
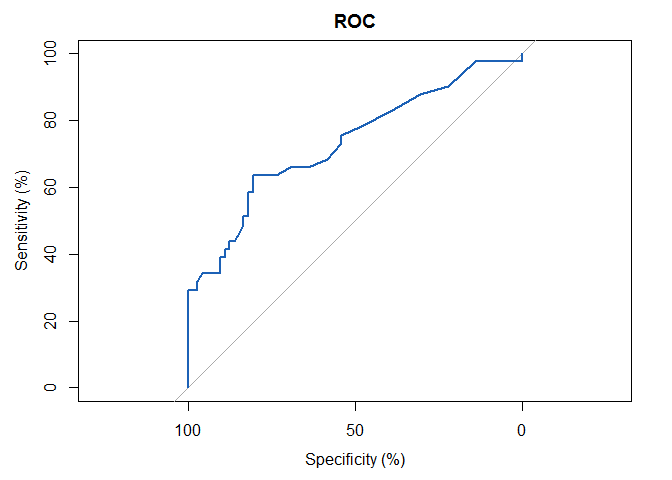
# plot roc curve with pROC package
rocobj <- plot.roc(aSAH$outcome, aSAH$s100b, percent = TRUE, main="ROC", col="#1c61b6", add=FALSE)
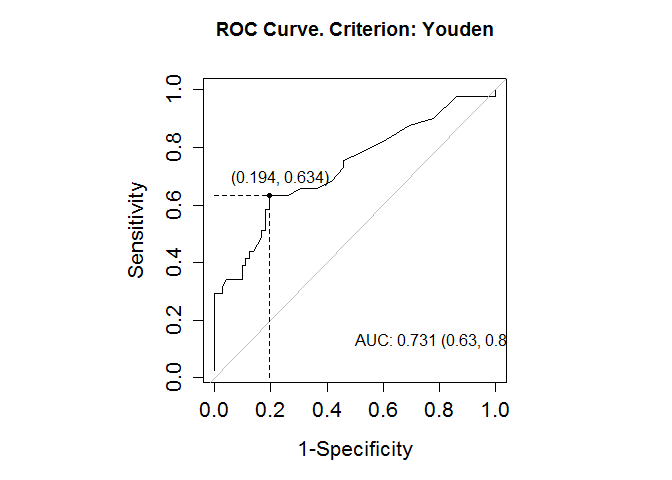
#Find cut-off with OptimalCutpoints package
optimal.cutpoint.Youden <- optimal.cutpoints(X = "s100b", status = "outcome", tag.healthy = 'Good', methods = "Youden", data = aSAH, pop.prev = NULL, control = control.cutpoints(), ci.fit = FALSE, conf.level = 0.95, trace = FALSE)

summary(optimal.cutpoint.Youden)
## Call:
## optimal.cutpoints.default(X = "s100b", status = "outcome", tag.healthy = "Good",
## methods = "Youden", data = aSAH, pop.prev = NULL, control = control.cutpoints(),
## ci.fit = FALSE, conf.level = 0.95, trace = FALSE)
##
## Area under the ROC curve (AUC): 0.731 (0.63, 0.833)
##
## CRITERION: Youden
## Number of optimal cutoffs: 1
##
## Estimate
## cutoff 0.2200000
## Se 0.6341463
## Sp 0.8055556
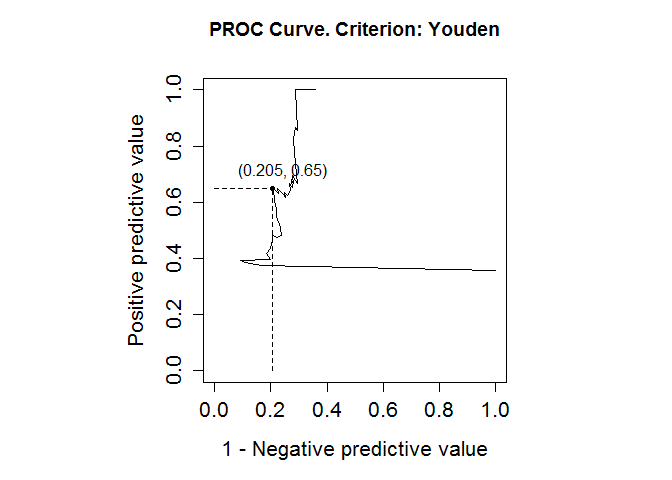
## PPV 0.6500000
## NPV 0.7945205
## DLR.Positive 3.2613240
## DLR.Negative 0.4541632
## FP 14.0000000
## FN 15.0000000
## Optimal criterion 0.4397019
plot(optimal.cutpoint.Youden)
 This method can find cut-off for one variable each time, but not for multiple variables
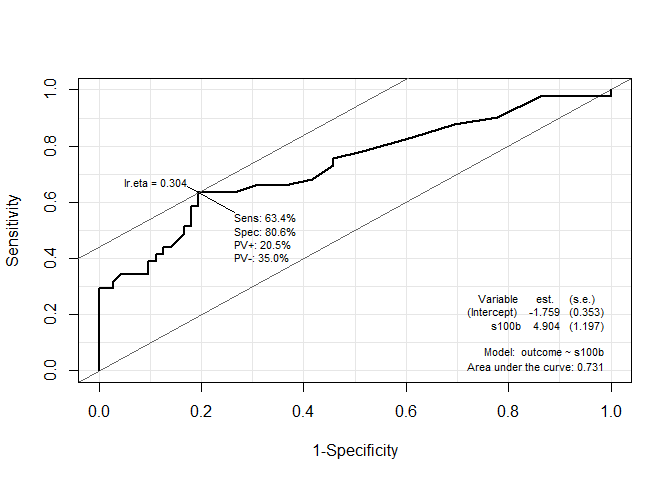
Find cut-off with Epi
The Epi package did was to fit a logistic regression
library(pROC)
library(Epi)

ROC(form=outcome~s100b, data=aSAH, plot = "ROC", MX = T)
ROC(form=outcome~ndka, data=aSAH, plot = "ROC", MX = T)
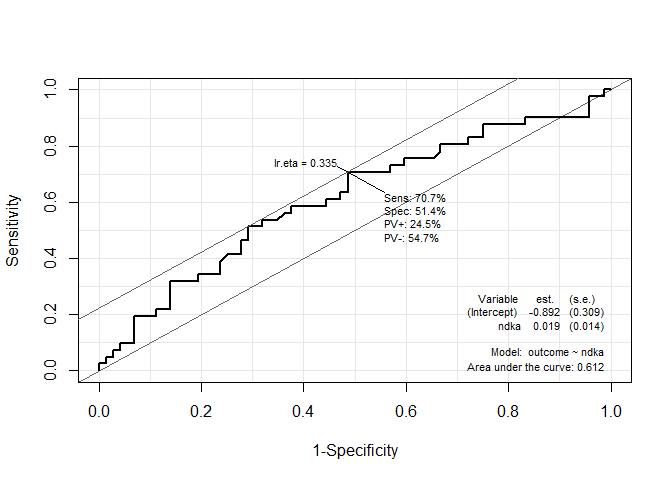
ROC(form=outcome~ndka+s100b, data=aSAH, plot = "ROC", MX = T)
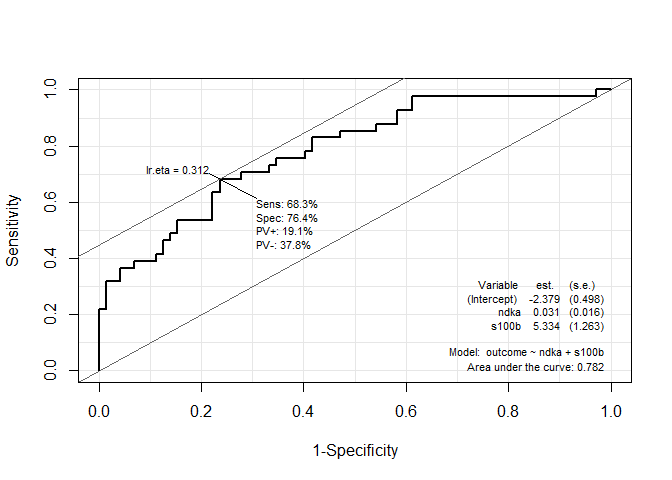
Relationships between Epi results and logistic regression
The Epi package did was to fit a logistic regression
Detailed information can be found here
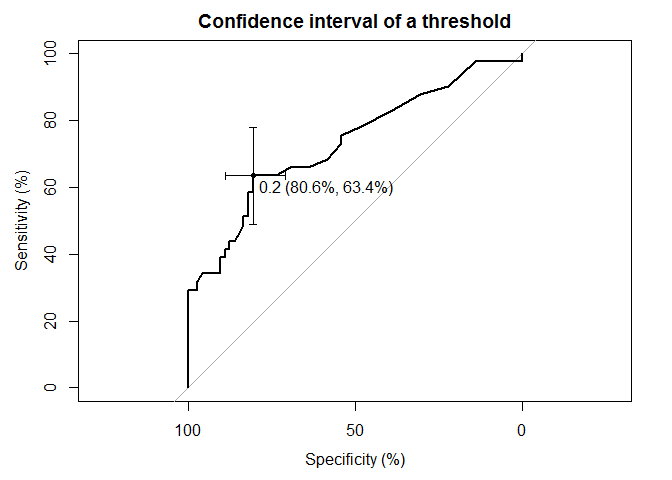
Find cut-off with pROC
library(pROC)
data(aSAH)

plot.roc(aSAH$outcome, aSAH$s100b,main="Confidence interval of a threshold",
         percent=TRUE, ci=TRUE, of="thresholds", # compute AUC (of threshold)
         thresholds="best", # select the (best) threshold
         print.thres="best") # also highlight this threshold on the plot
References
Youden’s J statistic
OptimalCutoff Youden index calculation
ROC and multiROC analysis: how to calculate optimal cutpoint?
How are the threshold or cutoff points in {Epi} R package selected?
HANDLING OF ROC CURVES
pROC